Live Solar Activity & Geomagnetic Shifts
Is There a Solar Storm Warning Today?
Stay ahead of cosmic shifts with our live solar activity forecast. By monitoring real-time solar flares and the Kp index, we help you understand how today's geomagnetic space weather impacts both the Earth's magnetic field and your personal energy.
How to Forecast Space Weather
Forecasting space weather is a 3-step process. Each step asks a different question and uses different data on this page. Click any step to jump to its data.
Where is the energy?
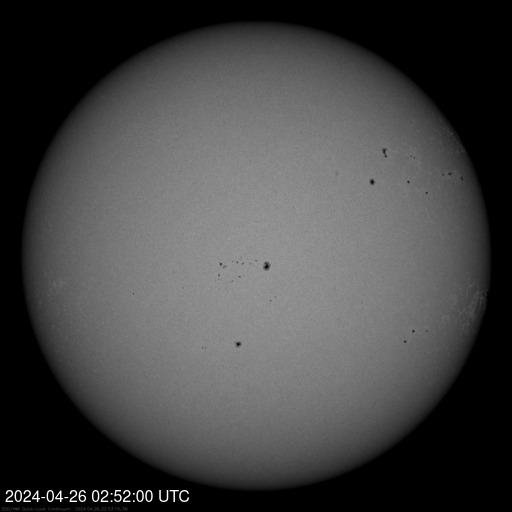
Count active sunspot regions, watch the corona for bright loops, check the X-ray flux for live flare activity. Big complex regions = high flare risk.
Is anything coming our way?
Use the LASCO coronagraph to spot coronal mass ejections leaving the Sun. A halo CME aimed at Earth = G-storm in 1–3 days.
What's hitting Earth right now?
Check solar wind speed, density, and especially Bz at the L1 satellite (~30 min upstream). Bz southward + fast wind = aurora soon.
Tip: Space weather lives on three time scales — flares hit Earth in 8 minutes (light speed), proton storms in minutes to hours, CMEs in 1–3 days. Plan accordingly.
View the full 13-sign solar transit calendar on the Transits page.
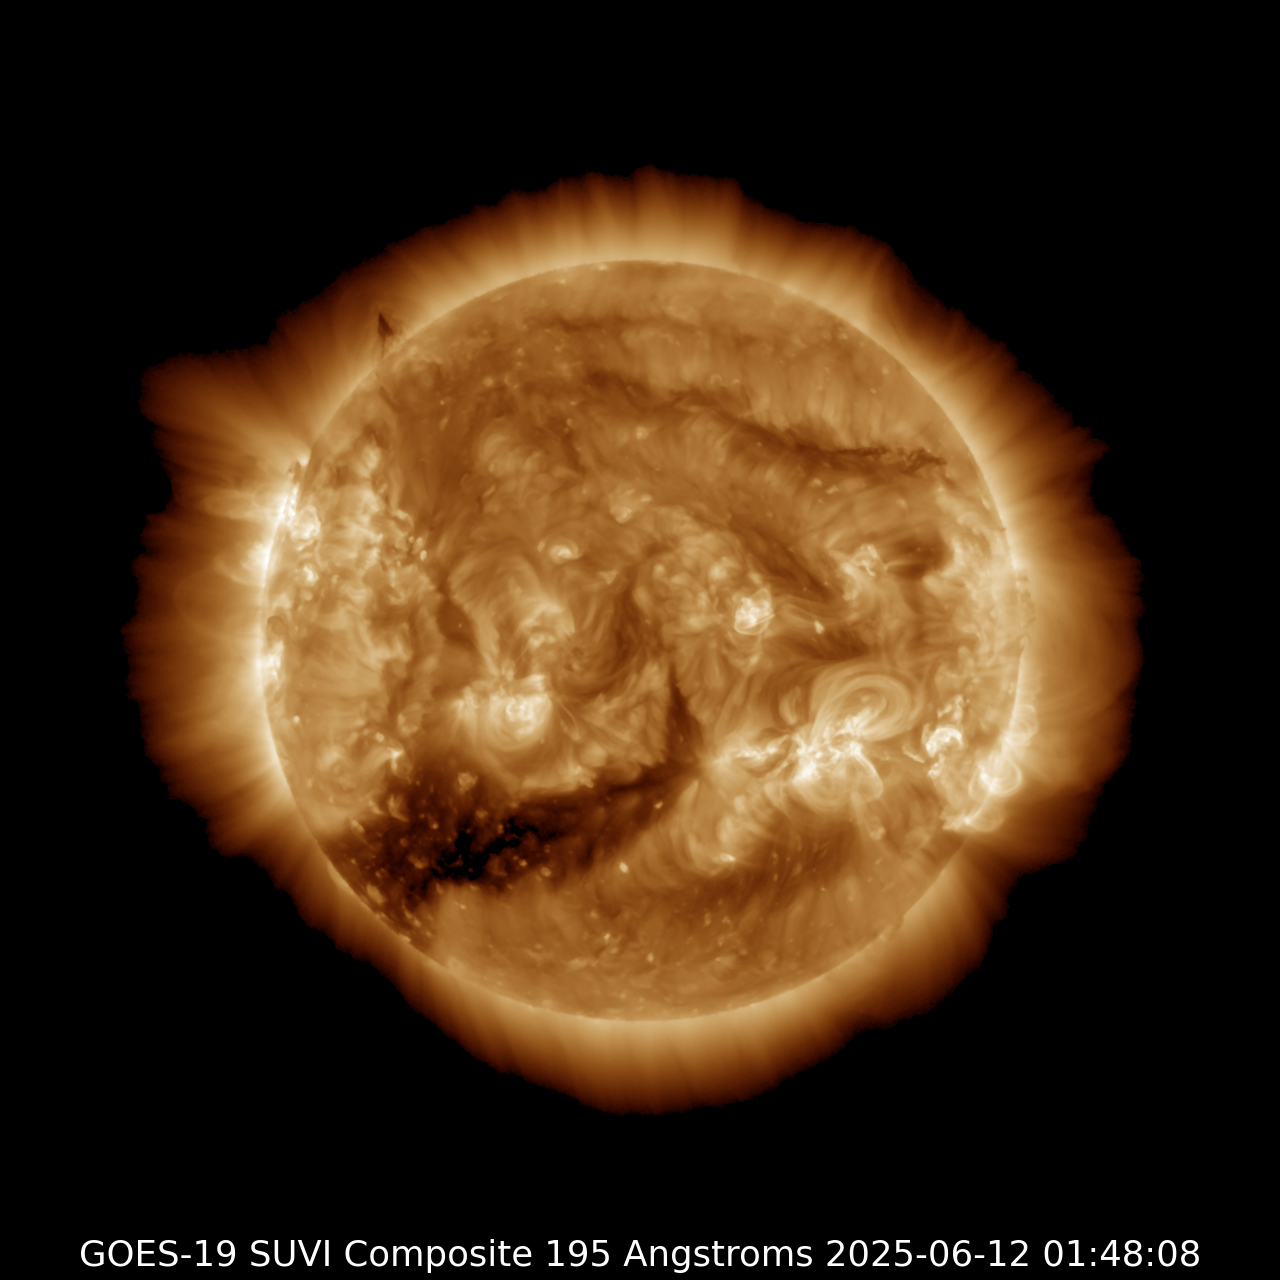
Live Solar Corona (193Å)
Bright loops and arcades show where magnetic energy is stored. Watch the limb (edges) for prominences and the disk for compact bright points — those are where flares ignite.
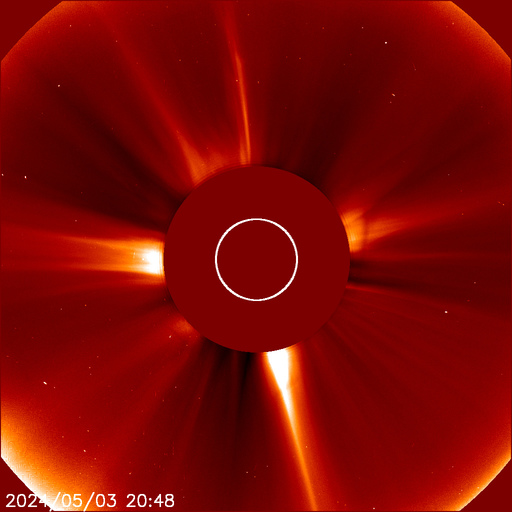
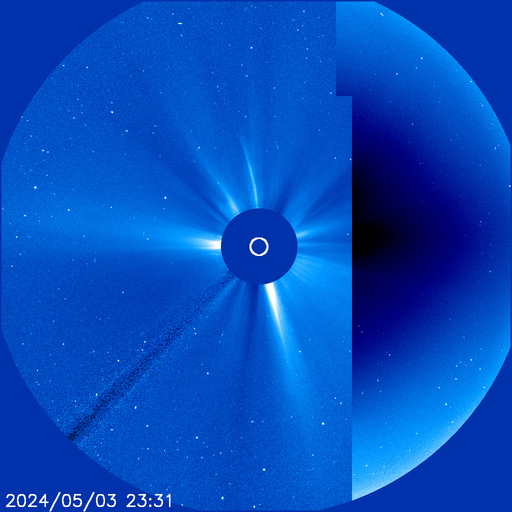
LASCO Coronagraph (SOHO C2 & C3)
A coronagraph blocks the bright Sun so you can see the faint outer corona — and any coronal mass ejections (CMEs) blasting away from it. A "halo" CME (expanding in all directions like a smoke ring around the Sun) means it's coming straight at Earth — expect a geomagnetic storm in 1–3 days.
Earth-Facing Sunspots & Active Region Map
Aurora Visibility
Current Conditions
| Bz (N/S Field) | ↑ 1.5 nT |
| Wind Speed | 357 km/s |
| Bt (Total Field) | 2.0 nT |
| Density | 2.9 p/cm³ |
Latest Flare
NOAA Space Weather Scales
NOAA SWPC issues a daily 3-day forecast on three scales: R (radio blackouts from flares), S (solar radiation storms from protons), and G (geomagnetic storms from CMEs & solar wind).
Chance NOAA assigns to a flare of each class — or a >10 MeV proton event — within the indicated 24-hour window.
| Window | C | M | X | Proton |
|---|---|---|---|---|
| Day 1 | 65% | 15% | 1% | 1% |
| Day 2 | 65% | 15% | 1% | 1% |
| Day 3 | 65% | 15% | 1% | 1% |
DSCOVR sits at L1 — about 1.5 million km upstream — giving us roughly 15–60 minutes warning before the solar wind hits Earth. The three numbers that matter most: speed (faster = more energy), density (more particles = stronger compression), and Bz (when it turns negative/southward, Earth's magnetic shield opens and aurora light up).
Solar Wind & Magnetic Field
DSCOVR L1 DATASolar Wind is a continuous stream of charged particles (mostly protons and electrons) ejected from the Sun's corona at speeds of 300–800 km/s. This plasma carries the Sun's magnetic field outward, filling the entire solar system. When enhanced by solar flares or coronal mass ejections, the solar wind intensifies and can drive geomagnetic storms on Earth.
Interplanetary Magnetic Field (IMF) is the Sun's magnetic field carried by the solar wind. Its orientation—especially the north-south component (Bz)—determines whether solar wind energy couples with Earth's magnetosphere. The data below is measured by the DSCOVR satellite at the L1 Lagrange point, about 1.5 million km sunward of Earth, giving us ~15–60 minutes warning before space weather arrives.