Solar Activity & Space Weather

Real-time space weather monitoring from NOAA SWPC. Track solar wind speed, Bz polarity, proton density, X-ray flux, and solar flare activity. View NASA SDO/AIA solar imagery and 3-day geomagnetic forecasts for aurora visibility and electromagnetic conditions.

Sun is transiting
Aquarius
Started Feb 16 12:57 PM
Element Air
Next Transit
Pisces
Begins Mar 12 02:34 PM
Element Water

View the full 13-sign solar transit calendar on the Transits page.

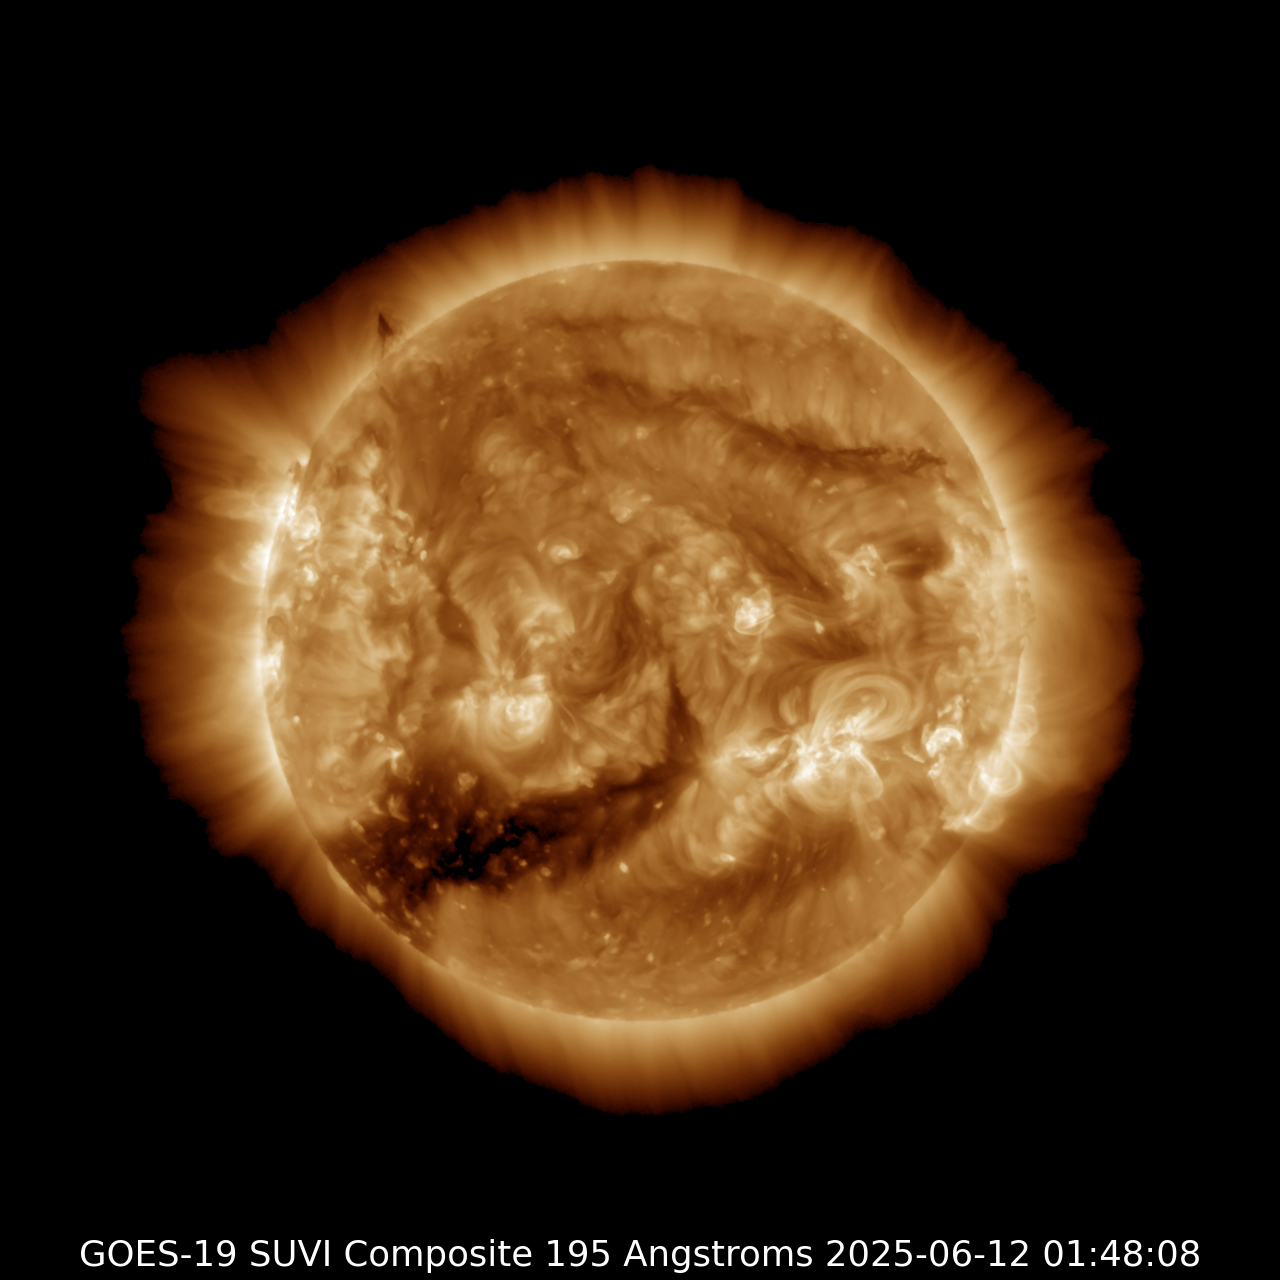
Live Solar Corona (193Å)

0:00
193 Angstroms (EUV) — Shows the Sun's outer atmosphere (corona) at ~1.25 million °C. Bright regions are active areas with strong magnetic fields. Loops and arcs trace magnetic field lines. Dark areas (coronal holes) are where solar wind escapes into space. Flares appear as sudden bright flashes. Source: NASA Solar Dynamics Observatory (SDO/AIA) — Updated every 15 minutes

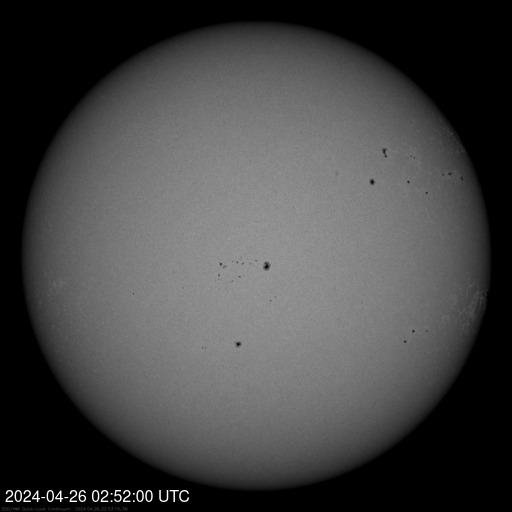
Earth-Facing Sunspots & Active Region Map

SDO/HMI Intensitygram — Real satellite image with labeled active regions. Dark spots are sunspots. Numbers show NOAA region IDs.
SDO/HMI Solar Image
Active Sunspot Regions
Loading sunspot data...
Flare Potential Color Key
High (Delta)
Moderate (Gamma)
Low (Beta)
Minimal (Alpha)
Sunrise
--
Sunset
--
Daylight
--

Aurora Visibility

QUIET (Kp 1) — Minimal geomagnetic activity. Bz is northward — Earth's magnetic shield is deflecting incoming solar wind. Auroras limited to polar regions (above 65°N). Low chance of visible aurora at lower latitudes.

Current Conditions

Bz (N/S Field) ↑ 2.7 nT
Wind Speed 347 km/s
Bt (Total Field) 4.5 nT
Density 5.7 p/cm³

Latest Flare

Last Flare
C2.0
Current flux: 1.2×10^-6 W/m²
Flare Classification
X Major — Radio blackouts, radiation storms
M Moderate — Brief radio blackouts at poles
C Minor — Little to no Earth impact
B/A Background — Normal solar activity
W/m² = X-ray power per square meter measured by GOES satellites. Flare class is based on peak flux: B=10⁻⁷, C=10⁻⁶, M=10⁻⁵, X=10⁻⁴. A C5.4 flare peaked at 5.4×10⁻⁶ W/m². Current flux may differ as flares rise and decay.

NOAA Space Weather Scales

24-Hour Observed Maximum
R
none
S
none
G
none
Latest Observed
R
none
S
none
G
none
Scale Reference
R — Radio Blackout
Caused by solar flares. Intense X-ray and UV emissions ionize Earth's upper atmosphere, disrupting high-frequency (HF) radio communication used by aviation, maritime, and emergency services. Higher levels can degrade GPS accuracy and satellite communication.
S — Solar Radiation Storm
Caused by high-energy protons accelerated by solar flares or coronal mass ejections. These particles can penetrate Earth's magnetosphere at the poles, posing radiation risks to astronauts and high-altitude air travel, degrading satellite electronics, and disrupting polar radio communication.
G — Geomagnetic Storm
Caused by coronal mass ejections (CMEs) or high-speed solar wind streams interacting with Earth's magnetic field. These storms can produce auroras visible at lower latitudes, induce currents in power grids, affect satellite orbits through atmospheric drag, and disrupt navigation systems.
Severity Levels
0 — None 1 — Minor 2 — Moderate 3 — Strong 4 — Severe 5 — Extreme

Solar Wind & Magnetic Field

DSCOVR L1 DATA

Solar Wind is a continuous stream of charged particles (mostly protons and electrons) ejected from the Sun's corona at speeds of 300–800 km/s. This plasma carries the Sun's magnetic field outward, filling the entire solar system. When enhanced by solar flares or coronal mass ejections, the solar wind intensifies and can drive geomagnetic storms on Earth.

Interplanetary Magnetic Field (IMF) is the Sun's magnetic field carried by the solar wind. Its orientation—especially the north-south component (Bz)—determines whether solar wind energy couples with Earth's magnetosphere. The data below is measured by the DSCOVR satellite at the L1 Lagrange point, about 1.5 million km sunward of Earth, giving us ~15–60 minutes warning before space weather arrives.

BZ
2.7
nT
Bz (North-South Field): Earth's magnetic shield. When Bz points south (negative), it opens a gap in our magnetosphere, allowing solar wind energy to pour in—triggering geomagnetic storms and auroras. Northward (positive) Bz means the shield holds strong.
+5 to +20 Strong shield 0 to +5 Quiet 0 to −5 Mild opening −5 to −10 Moderate storm risk below −10 Strong/Severe storm
BT
4.5
nT
Bt (Total Field): The overall strength of the interplanetary magnetic field. Higher Bt with southward Bz = more intense geomagnetic activity.
<5 nT Quiet 5–10 nT Moderate 10–20 nT Elevated >20 nT Strong/Severe
SPEED
347
km/s
Speed: How fast the solar wind is traveling. Normal speed is ~400 km/s. Above 500 km/s is elevated; above 700 km/s is a high-speed stream.
<400 km/s Normal 400–500 km/s Elevated 500–700 km/s High >700 km/s Extreme
DENSITY
5.7
p/cm³
Density: How dense the solar wind is. Higher density + higher speed = greater impact force on Earth's magnetosphere.
<5 p/cm³ Low 5–10 p/cm³ Normal 10–20 p/cm³ Elevated >20 p/cm³ High/Extreme
KP
1.0
index
Kp Index: Global geomagnetic activity level (0-9). Kp 5+ indicates storm conditions; higher values mean stronger geomagnetic disturbance and aurora visibility at lower latitudes.
0–2 Quiet 3 Unsettled 4 Active 5 Minor Storm 6–7 Strong Storm 8–9 Severe/Extreme

L1 Space Weather Chart (24-Hour View)

How to Read This Chart: Look for correlations between solar flares () and changes in solar wind conditions. When a flare produces a Coronal Mass Ejection (CME), you'll typically see a sudden jump in wind speed and density 1-3 days later, often accompanied by a sharp swing in Bz to southward (negative) values. Can you identify which flares resulted in Earth-directed CMEs?
📱 Rotate your device to landscape for a better view of this chart
Use checkboxes above to show/hide data layers
Data updated 0 minutes ago • Source: NOAA SWPC